| IAP Software ™ |  |
| IAP Software ™ | |
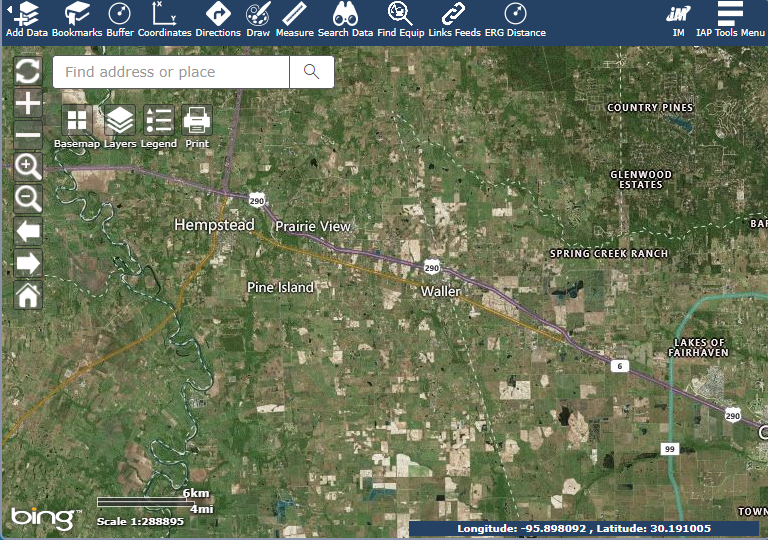
Map - Common Operating Picture
The Common Operating Picture (COP) is a command and control tool that provides situational awareness for users. Spatial Data is Integrated from multiple sources to support all functions of a response.
Contents
Along the left-hand side of the Common Operating Picture map are basic navigation tools which can be used to zoom in and out, refresh the map, or go to the home map extent.
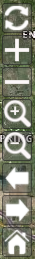
Click the Refresh Map button  to reload the map data and zoom to the incident location.
Click the Zoom In button  to zoom in one zoom level.
Click Zoom Out button  to zoom out one zoom level.
Click the Zoom In Rectangle button  . On the COP click and hold and draw a rectangle to zoom in to the area of interest.
Click the Zoom Out Rectangle button  . On the COP click and hold and draw a rectangle to zoom out.
Click the Zoom Previous button  to zoom to the previous extent.
Click the Zoom Forward button  to zoom to the forward extent.
Click the Home button  to zoom to home extent.
Use the Search field to navigate to an address or specific location.
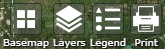
There are several basic widgets included in the COP which allow the user to change the basemap, configure layers within the COP, view a legend, and save a version of the map for printing.
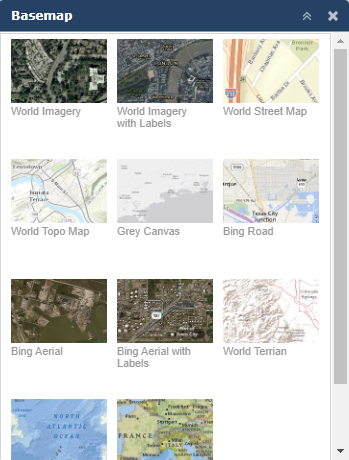
This feature allows users to choose which basemap to display within the COP.
Click the Basemap button  to open the panel on the right side.
Select the needed basemap. After clicking, the basemap will automatically be applied to the COP.
Close the Basemap panel by clicking the  in the top right corner.
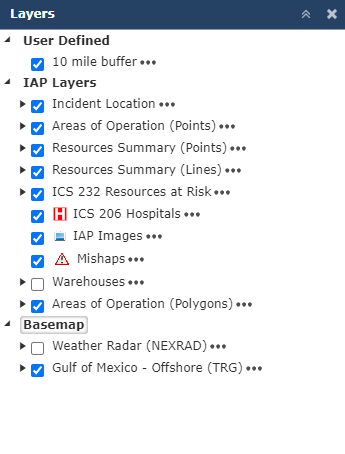
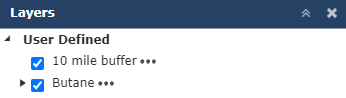
This widget allows users to select which currently existing layers are displayed on the map.
Click on the Layers button  to open the panel on the right side.
Use the Expand arrow  to view sub layers.
Use the checkboxes to select or unselect the layers to display the data or imagery on the map.
Close the Layers panel by clicking the  in the top right corner.
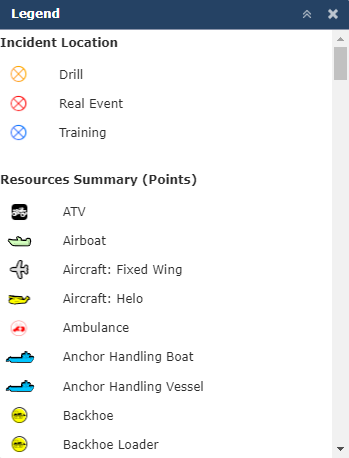
The legend provides a quick reference for all symbology used within the COP.
Click the Legend button  to open the panel on the right side to view map symbols.
Close the Legend panel by clicking the  in the top right corner.
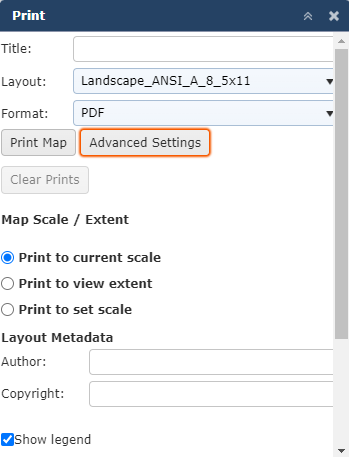
The print widget allows users to create a map with a defined map extent and data displayed. NOTE: Print Map will only work with manually configured layers, not Webmaps.
Arrange the current view of COP to show the map extent and map data to be included in the printed map version.
Click the Print button  to open the panel on the right side.
Free type to enter the map Title. Use the drop-down  provided to select the printed Layout and the file Format. Click the Advanced Settings button
  to change advanced settings, if needed.
Click the Print Map button  . The map will be created and a hyper link will be listed below the print map button.
Click the hyper link  to view and send the map to a printer.
The Clear Prints button  can be used to clear the list of available maps to be printed.
The Widget Toolbar provides users access to multiple widgets that are available for use in the Common Operating Picture.


Add Data is used to add shapefiles, KML/KMZ, Web Mapping Service (WMS), or ArcGIS Server Service to the Common Operation Picture.
Click the Add Data icon  to open the pane on the right side.
Select the data format to be added to the COP using the provided drop-down list.
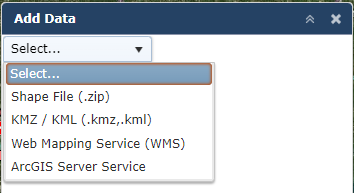
Click the Select button  . Choose an option from the dropdown.
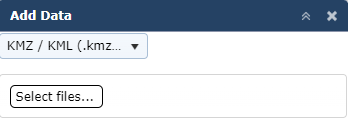
Select the Select Files button  . Then navigate to the file location and select the needed file.
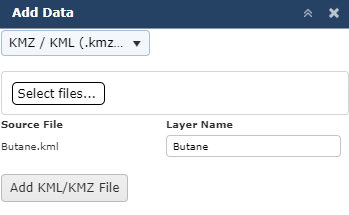
Click the Add button  to import the data layer. Data will be placed into the User Defined group inside the layers widget.
NOTE: The data layer will only be available to be viewed in the instance in which it is added.
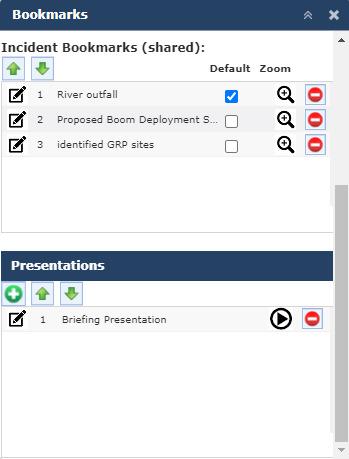
A bookmark is used to quickly zoom to a predefined area of interest with specific data layers turned on.
 to open the pane on the right side.
  to open the bookmark menu.
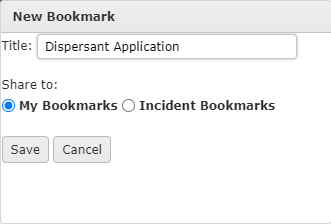
 to choose if the bookmark is only visible to the user or to the entire incident.
 NOTE: Incident Bookmarks are a restricted feature and can only be updated by users with the correct role permissions.
 to create the bookmark and make it available for use.
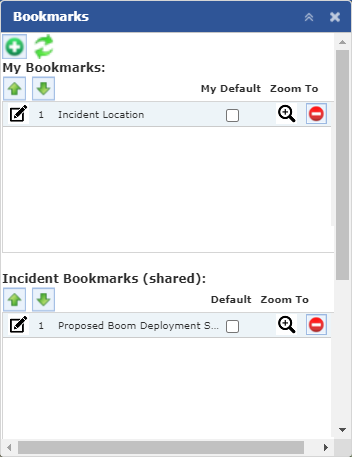
Once bookmarks have been created users are able to make modifications, as necessary.
Click the Edit button  to open the Edit Bookmark window. Then make the required changes before clicking the Save button
  .
.
When multiple bookmarks have been created the order in which they appear can be edited by selecting a bookmark and then using the Move Up and Move Down buttons  .
.
Use the checkbox  to set a default bookmark.
Use the Delete button  to remove bookmarks that are no longer needed.
A presentation of existing bookmarks can be created and saved for use later.
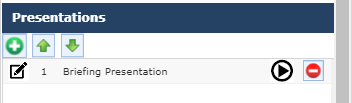
Click the Add button  under Presentations to open the New Presentation pane.
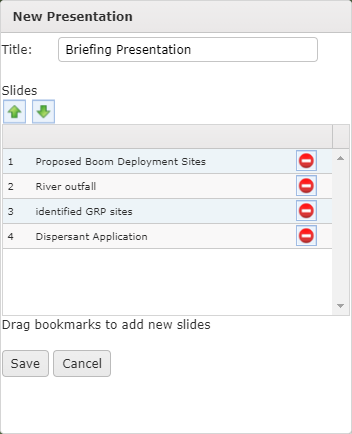
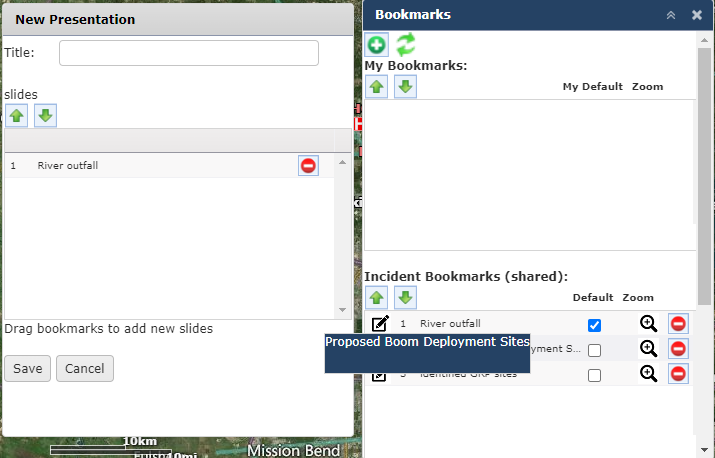
Free type to add a Title for the presentation.
Drag and drop existing bookmarks from the Bookmarks pane to the New Presentation pane to add them to presentation.
Use the Move Up and Move Down buttons  to order the bookmarks then click the Save button
  to create the presentation and make it available for use.
Click the Play Button  to open a new tab in IAP to view presentation.
Buffers can be created based on a point, line, circle, rectangle, or polygon. A Buffer is used to show a point, line, or area and a designated zone of distance around the area.
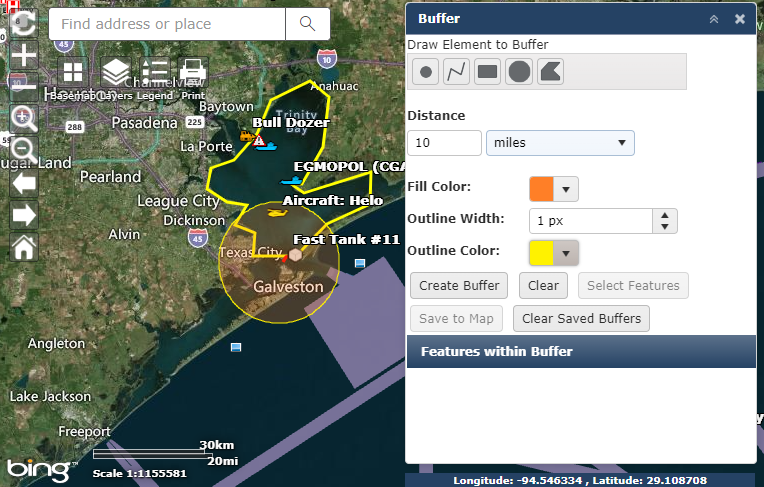
Click the Buffer icon  to open the pane on the right side.
Click to select the Element type  for the buffer.
Free type to add the Distance value of the buffer and use the drop-down to select the unit of measure.
Select the Fill Color, Outline Width, and Outline Color using the drop-down provided.
Select the Create Buffer button  to apply the parameters selected.
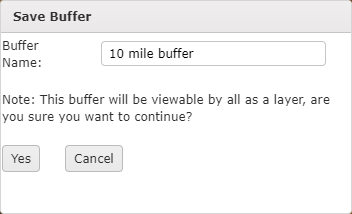
User can save the buffer to the map as a layer by clicking the Save to Map button  . The Save Buffer window will open where the user can then name the buffer. After clicking Yes the buffer will be saved under the user defined group in the layers list.
Once the buffer has been created user can see the features within the buffer by clicking the Select Features button  .
.
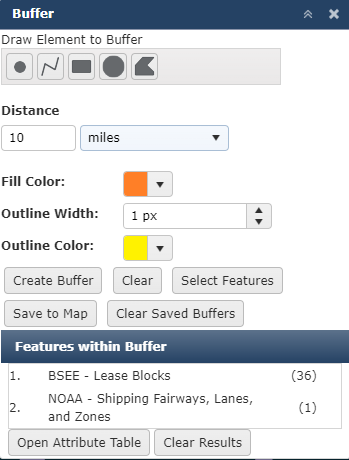
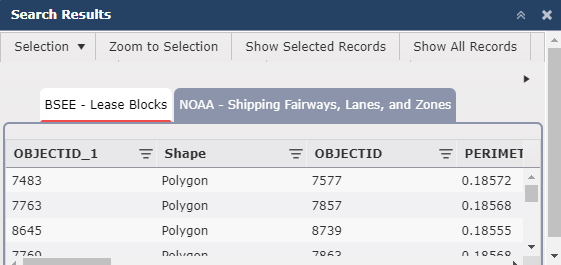
Clicking the Open Attributes Table button  will open a new window with detailed attribute information for the features. To close the Attributes Table click the Clear Results button
  .
.
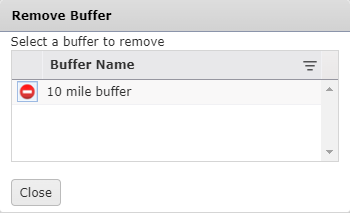
To remove a buffer click the Clear Saved Buffers button  . The Remove Buffer window will open. Use the Delete button
  to remove buffers, as necessary, then click the Close button
  .
.
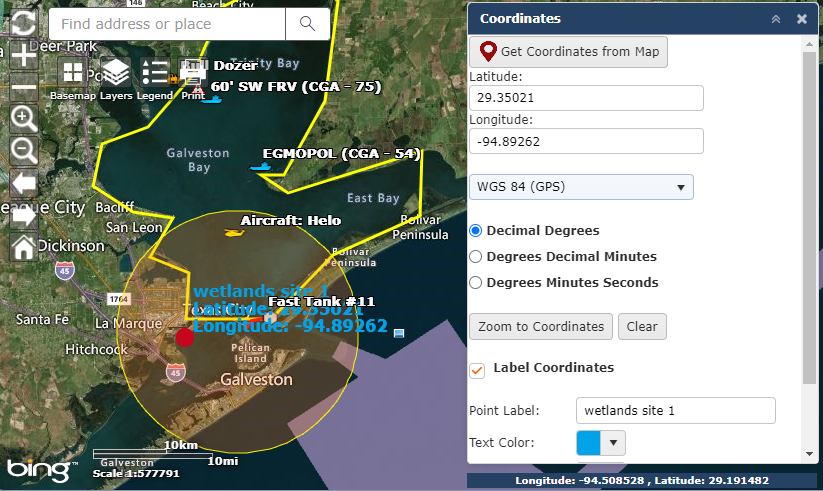
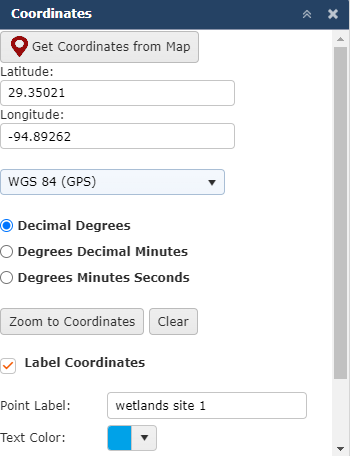
The Coordinates widget can be used to add a point to the map or to navigate to a designated point.
Click the Coordinates icon  to open the pane on the right side.
Use either the Get Coordinates from Map or Zoom to Coordinates option to find a location on the map.
Click the Get Coordinates from Map button  , then click on a location within the map to place a marker on the COP and display the coordinates of the selected point.
Use the radio buttons to choose the coordinate format 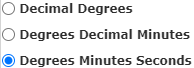 . Then type the coordinates into the Latitude and Longitude boxes. Finally click the Zoom to Coordinates button
  .
.
Use the checkbox to determine if the point will be labeled on the map. add a label if needed, change text and marker color. Free type to add a Point Label to the point. Use the drop-down menus to select the Text Color and Marker Color.
NOTE: If the Point Label is to be included on the map the Label must be entered before clicking either the Get Coordinates from Map or Zoom to Coordinates button.
The directions widget can be used to get detailed directions between two or more map locations.
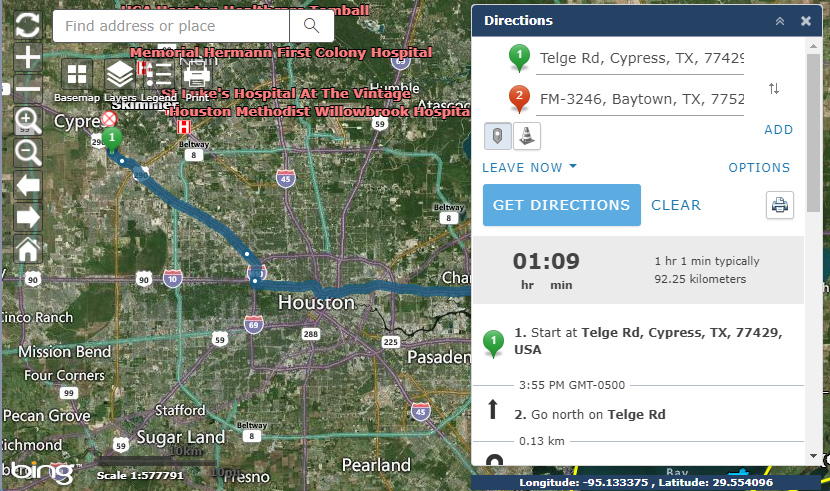
Click the Directions icon  to open the pane on the right.
Click on the map to add as starting point and destination or free type to add known addresses.
Click the Add button  to add multiple waypoints or use the Add a Waypoint button
  to select a location on the map.
Use the Barriers button  to draw a barrier on the map and route the directions around the barrier.
Click the drop-down next to LEAVE NOW  to choose a different starting time.
Click the Options button  to expand more options including change the units of measure, show live traffic, or return to start.
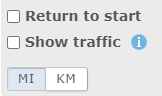
Click the Get Directions button  to map the route.
Click the Print button  to print directions.
The Draw widget allows users to draw shapes onto the map.
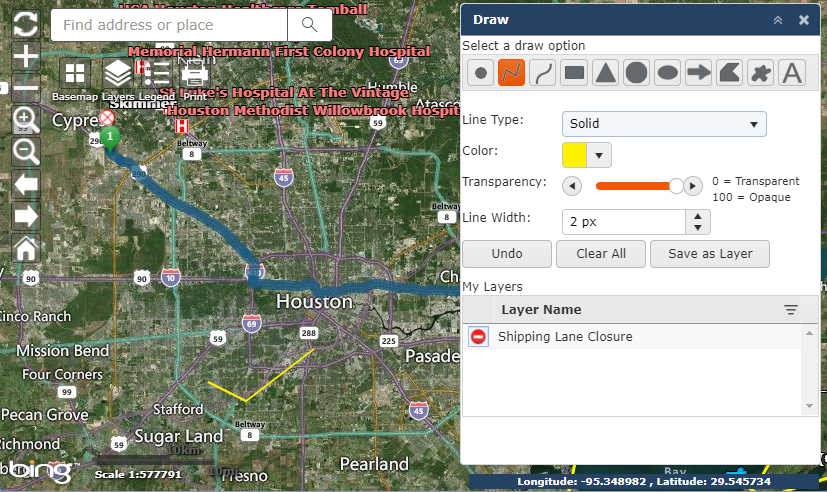
Click the Draw widget  to open the pane on the right.
Click to select a draw option (Point, line, polygon, or text) 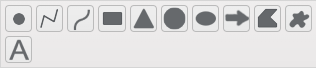 .
.
Use the options provided to choose the attributes that will be applied such as Color, Transparency Level, and Size.
NOTE: The attributes available are dependent on which draw option is chosen.
Click and draw on the COP as needed.
To save the sketch as a layer, click the Save as Layer button  . Then give the layer a Title and click the Save button
  .
.
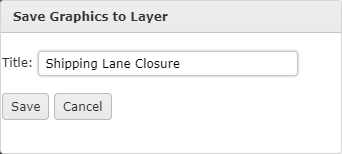
The layer will be saved and listed within the draw pane.
NOTE: The Save Graphics to Layer option only saves to the user’s personal view of the COP.
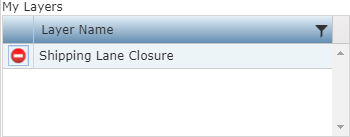
To delete a layer, click the Delete button  associated with the layer on the My Layers list.
The Measure widget can be used to measure distance between points, to measure the area within a polygon, or get coordinates off the location of a point.
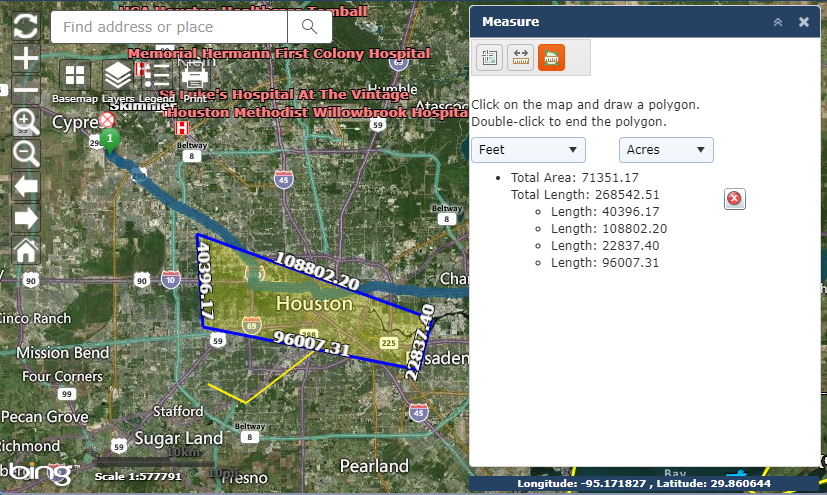
Click the Measure widget  to open the pane on the right.
Choose one of the measure options:
Point  Click on the map to return the coordinate location of the point.
Line  Click on the map and draw a line. Double-click to end the line.
Polygon  Click on the map and draw a polygon. Double-click to end the polygon.
Use the drop-down menu(s) to select the unit of measure used to calculate the distance.
Each measurement will be listed on the menu below the units drop-down.
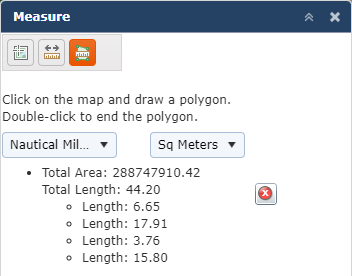
To remove a measurement from the map click the Delete button  .
.
Search Data enables users to search for features in the Common Operating Picture.
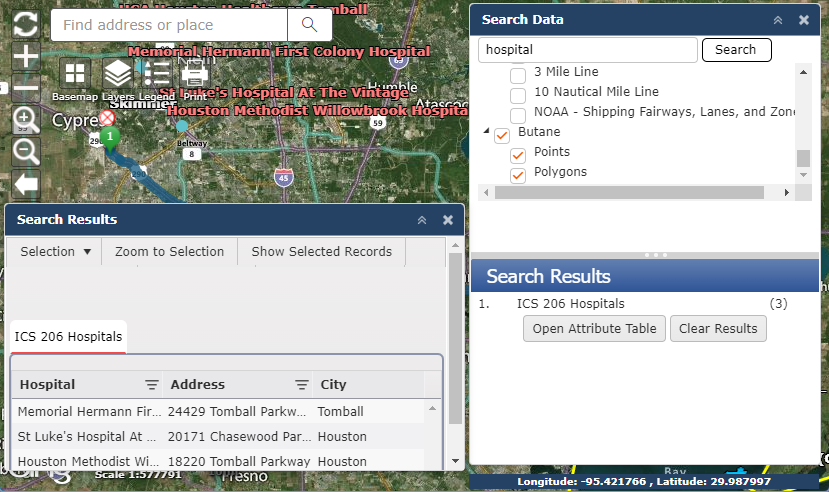
Click the Search Data widget  to open the pane on the right.
Click the check box  of the preferred category or manually enter the category in the search box.
Once all the categories are chosen, click the Search button  to get a list of all the data in the selected categories.
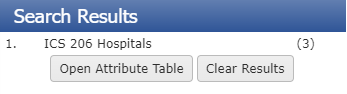
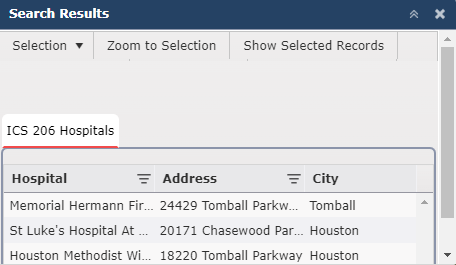
Click the Open Attribute Table button  to view the attributes of the search results.
The Find Equipment widget is used to search for available response equipment within a designated radius. The location of equipment is displayed on the map.
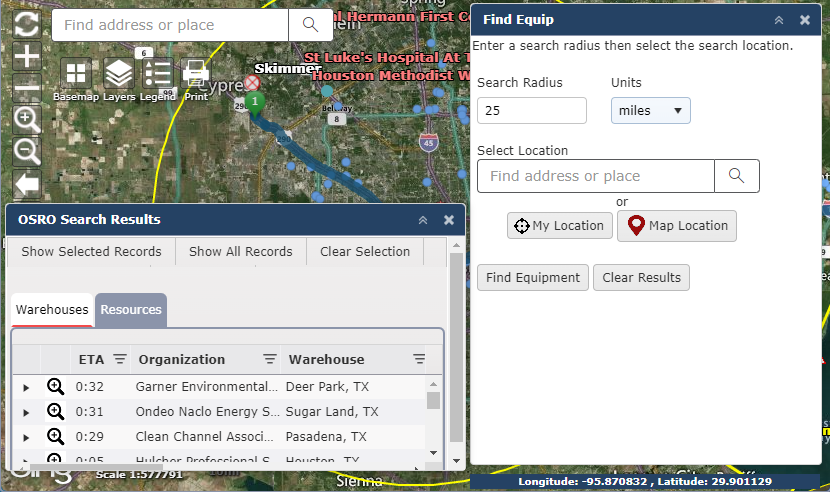
Click the Find Equipment widget  to open the pane on the right.
Enter the Search Radius and Units.
Select a Location by entering an address  , using the My Location button
  , or clicking a location on the map
  .
.
Then click the Find Equipment button  . A buffer will be created around the area selected and a table listing available resources will open on the bottom of the screen.
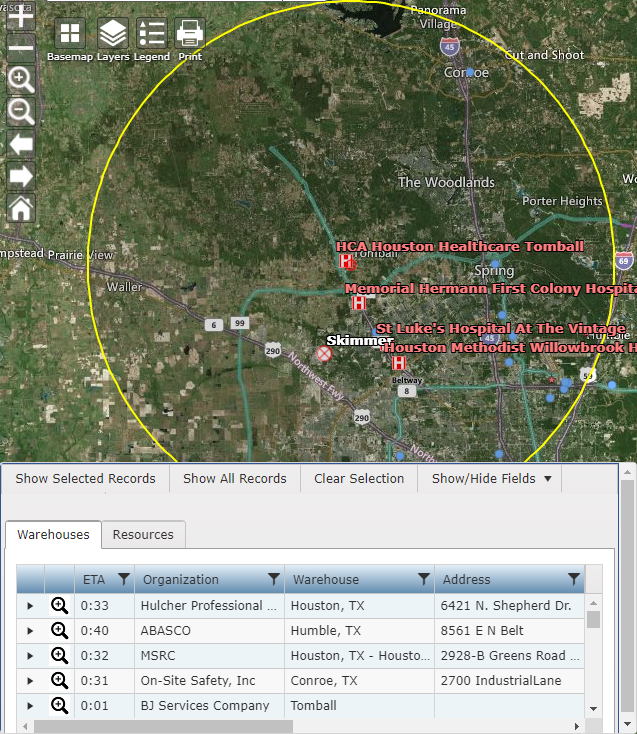
NOTE: ETA is based on straight line distance between two points “as the crow flies.”
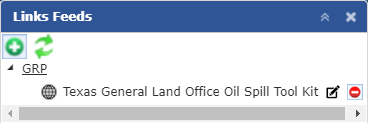
The Links/Feeds widget allow you to add link URLs and Upload Videos to be viewed within the Common Operating Picture. Click the Links Feeds widget  to open the pane on the right for Videos.
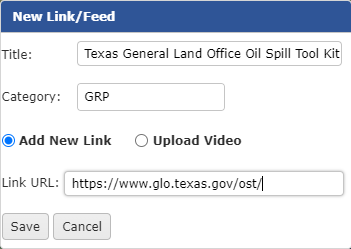
Click the Add button  to add a new Link.
Within the New Link/Feed window free type to add a Title and Category for the link. Click the Add New Link radio button and then add the Link URL by free typing or pasting the link address. Click the Save button  to add the link to the COP.
The link will be created and added to the Links Feeds pane under the category assigned.
After the link has been added it can be updated using the Edit button  or deleted by clicking the Delete button
  .
.
Click the Add button  to add a new Link.
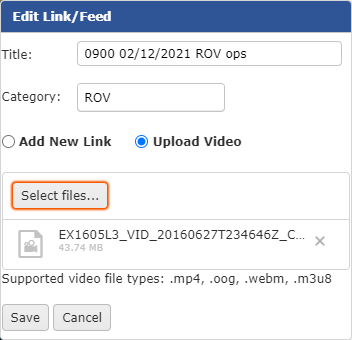
Within the New Link/Feed window free type to add a Title and Category for the link. Click the Upload Video radio button and then use the Select Files button  to navigate to and add video. Click the Save button
  to add the video to the COP.
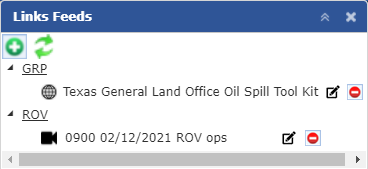
The video will be added to the Links Feeds pane under the category assigned.
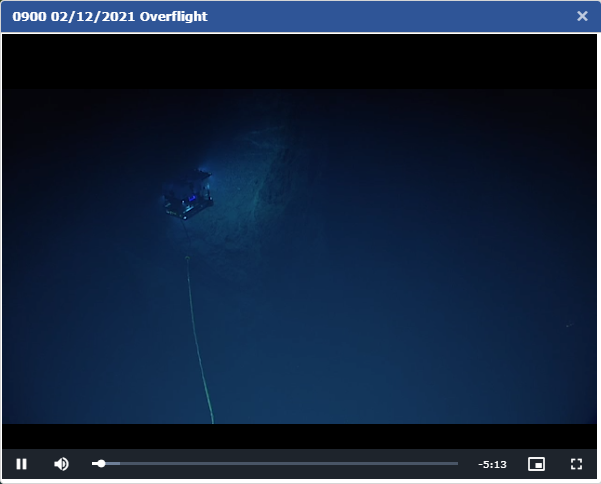
Click the Open Link button  to view the video. The video will open in a new window. The bottom of the video window has standard controls to pause, fast forward or rewind the video. Close the video window when you are finished in the top right corner.
After the video has been added it can be updated using the Edit button  or deleted by clicking the Delete button
  .
.
The ERG Distance widget is used to calculate and show a graphical representation of the Emergency Response Guide planning distance for the selected chemical substance.
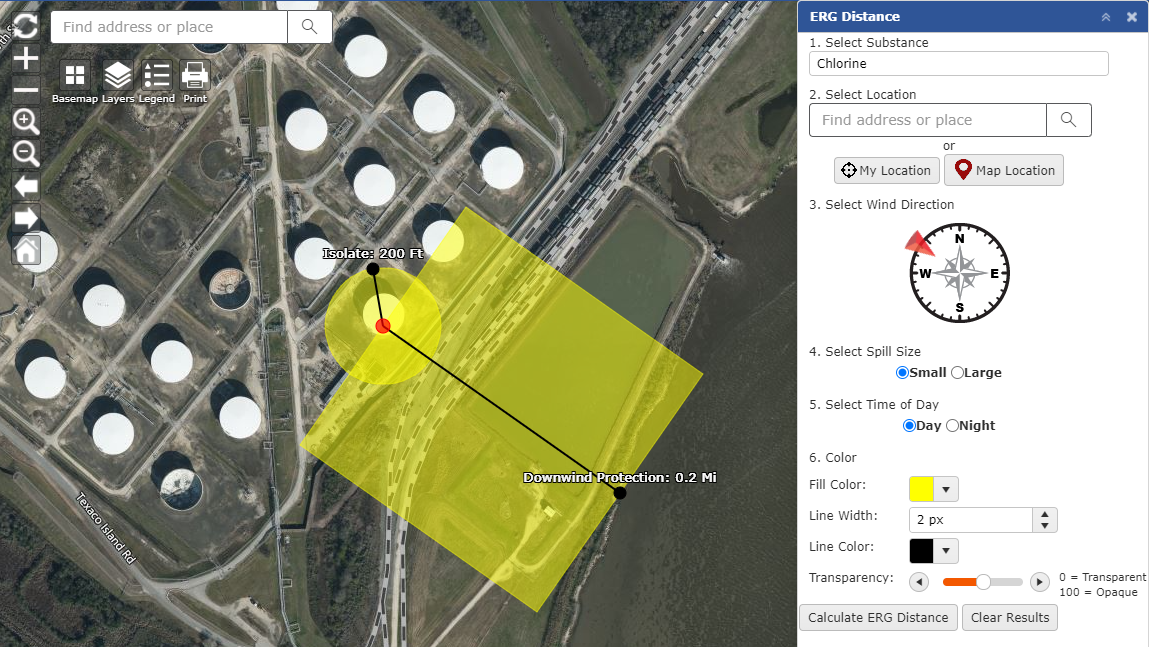
Click the ERG Distance widget  on to open the pane on the right.
Free type to search for in the product in the Select Substance drop-down  the select from the list.
Select a Location by entering an address  , using the My Location button
  , or clicking a location on the map
  .
.
Click and drag the red arrow on the compass to Select Wind Direction  .
.
Use the radio buttons to choose the Spill Size  and Time of Day
  .
.
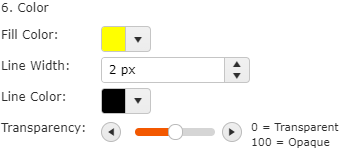
Customize the Color and Width of the distances along with the Transparency.
After all the options are chosen, click Calculate ERG Distance button  to finish.
A graphic will show up in the location chosen, showing the plume migration distance along with the isolation distance from the source.
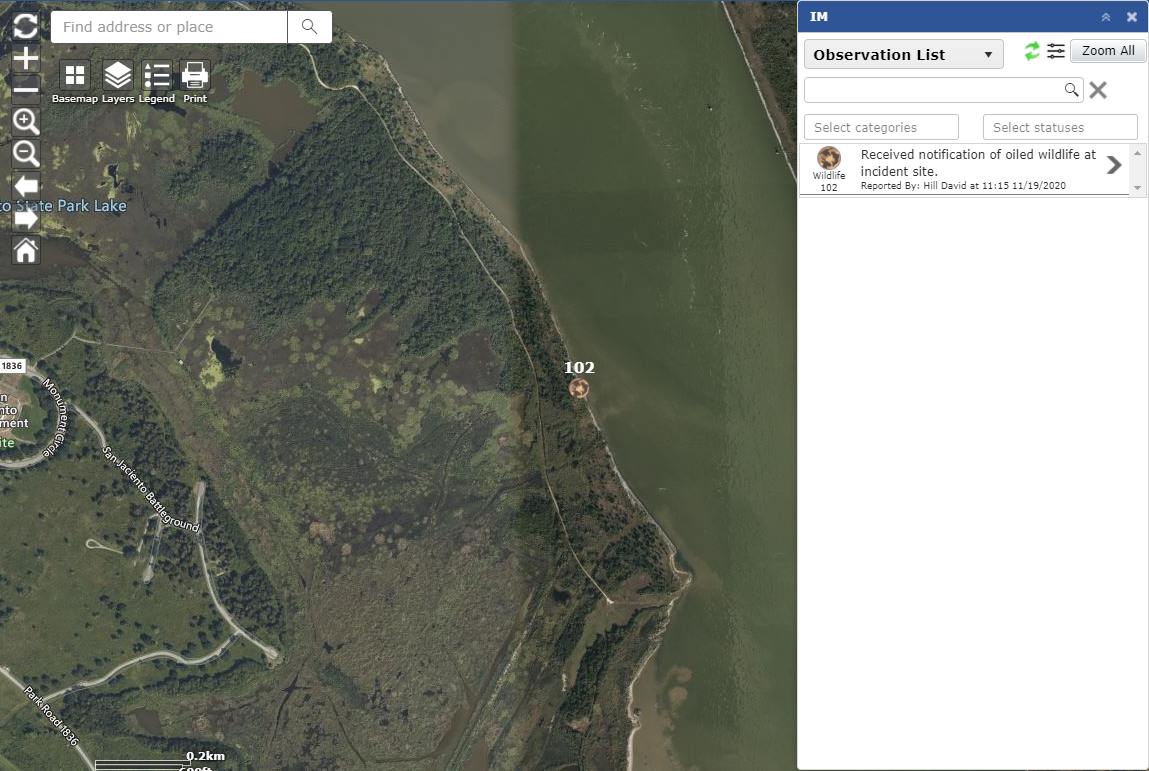
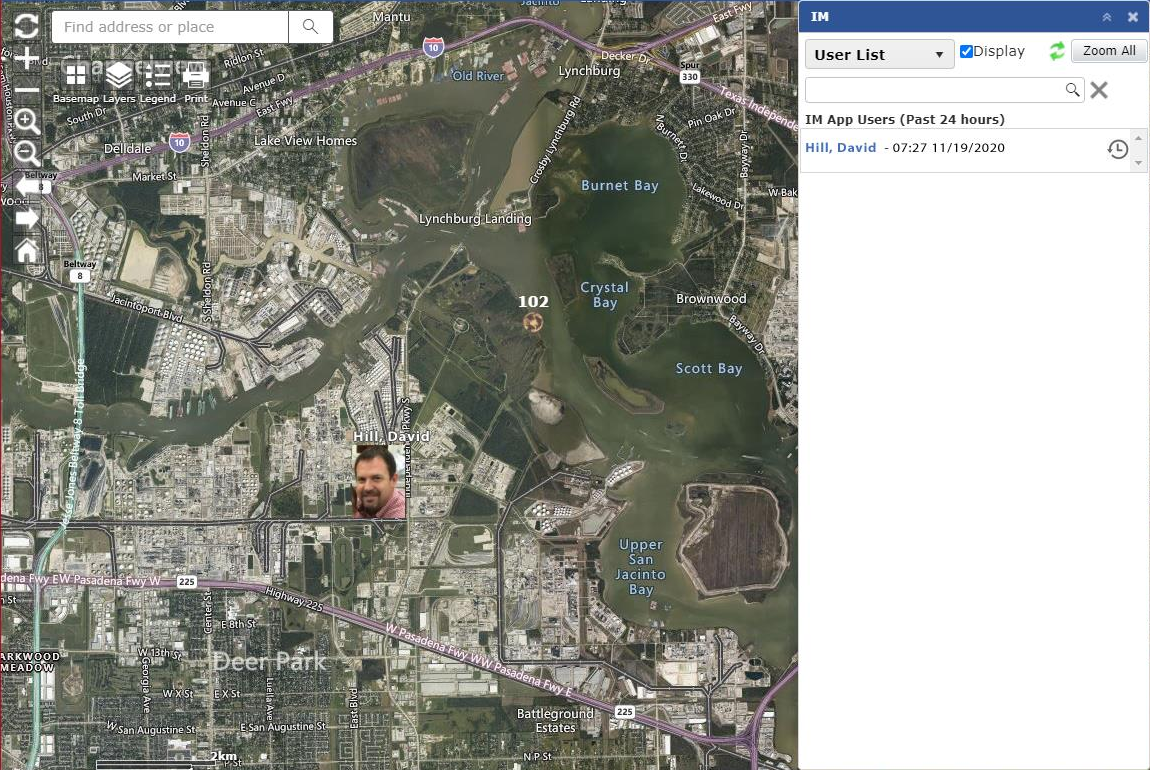
The Common Operating Picture links to the Information Manager Application. Reported observations can be displayed within the COP. Click the IM widget icon  to open the pane.
Use the drop-down list to choose the Observation List  . Then use the options provided to filter the list of observations.
Free type to use the Search field  .
.
Use the drop-down provided  to select observation Categories and Statuses to filter the list.
Use the Refresh button  to refresh the list of observations.
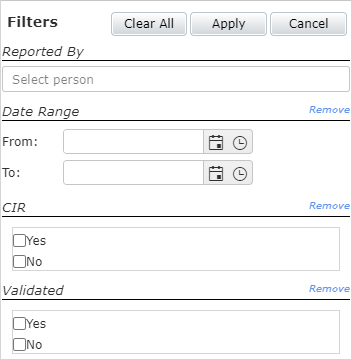
Use the Filter button  to apply additional filters.
Click the Zoom All button  to change the map extent to show all observations.
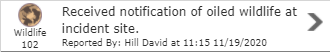
Click the Open icon  to expand details of an individual observation.
On the details window users can view additional details for the selected observation.
Click the Open 213 button  to open the Significant Event details associated with the observation.
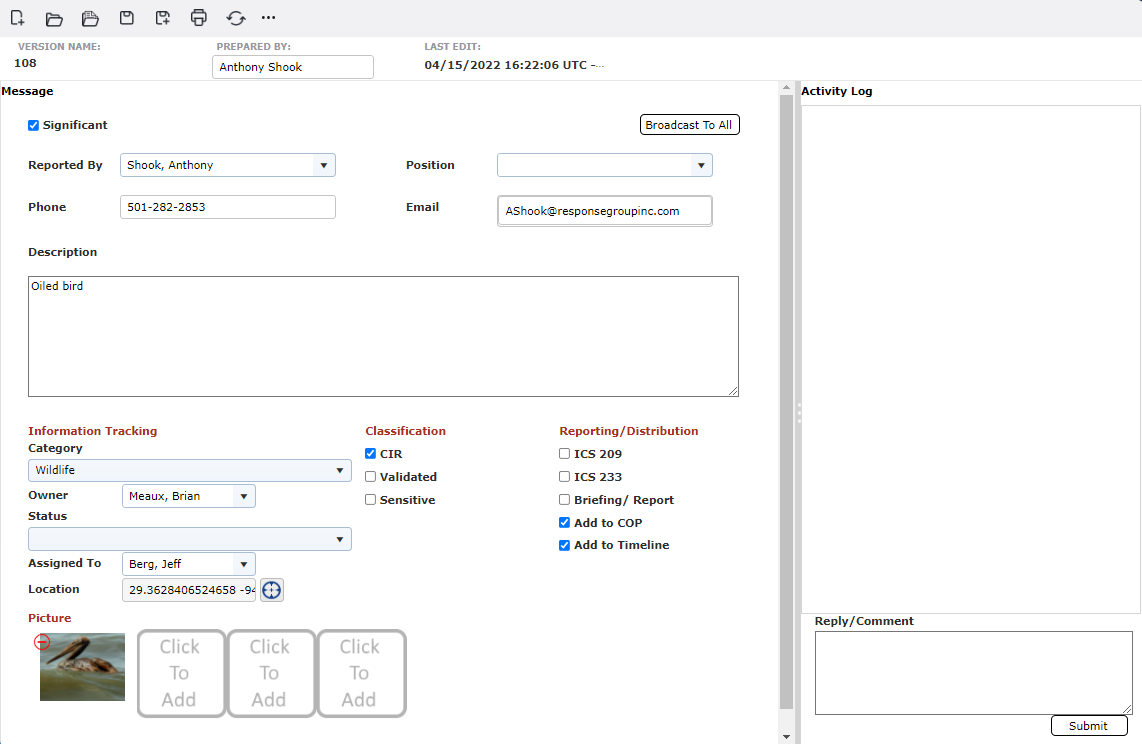
Click the Expand Contact Details button  to view additional details around the reporting party.
Click the Close icon  to return to the list of all observations.
Use the drop-down list to choose the User List  . Then use the options provided to filter the list of IM App users.
Free type to use the Search field  .
.
Use the Display checkbox  to determine if user locations are displayed on the map.
Use the Refresh button  to refresh the list of users.
Click the Zoom All button  to change the map extent to show all user locations.
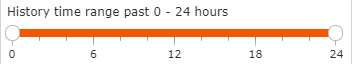
Click the History button  to select the length of time to display the user’s activity history on the map.
Click on the User’s Name 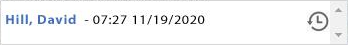 to change the map extent to show the user’s location.
The IAP Tool Menu is used to display information created using forms within the IAP Software.
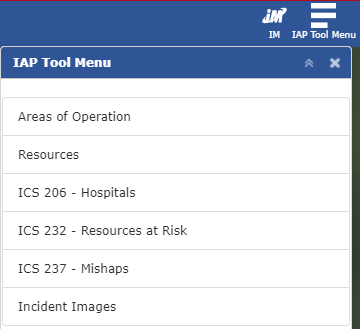
The top left of the display pane will show the name of the IAP Tool currently selected. On the right-hand side of the display are three options: Previous, Collapse, and Close.
Previous  will take the user back to the main IAP Tool Menu.
Collapse  will minimize the IAP Tool Menu pane.
Close  will close the IAP Tool Menu pane.
Use the Add button  to add a new item. The Delete button
  will remove the selected item.
NOTE: For more information on creating or deleting Areas see the Areas of Operation page. For more information on creating or deleting Resources see the Resources Summary page.
The Close and Unselect All button  will minimize any expanded areas and unselect them.
The Refresh button  will refresh the list of items.
Click the Zoom button  to center the map on the selected item. The Zoom All button
  will change the zoom extent to show all items on the map.
Use the Filter button  or drop-down list
 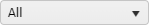 to filter the list of items displayed. The Filter by Date button
 allows users to filter the results by a date range.
Use the Search field  to filter the list to show only items that match the term entered.
All Areas of Operation that have been designated for the incident can be displayed on the COP.
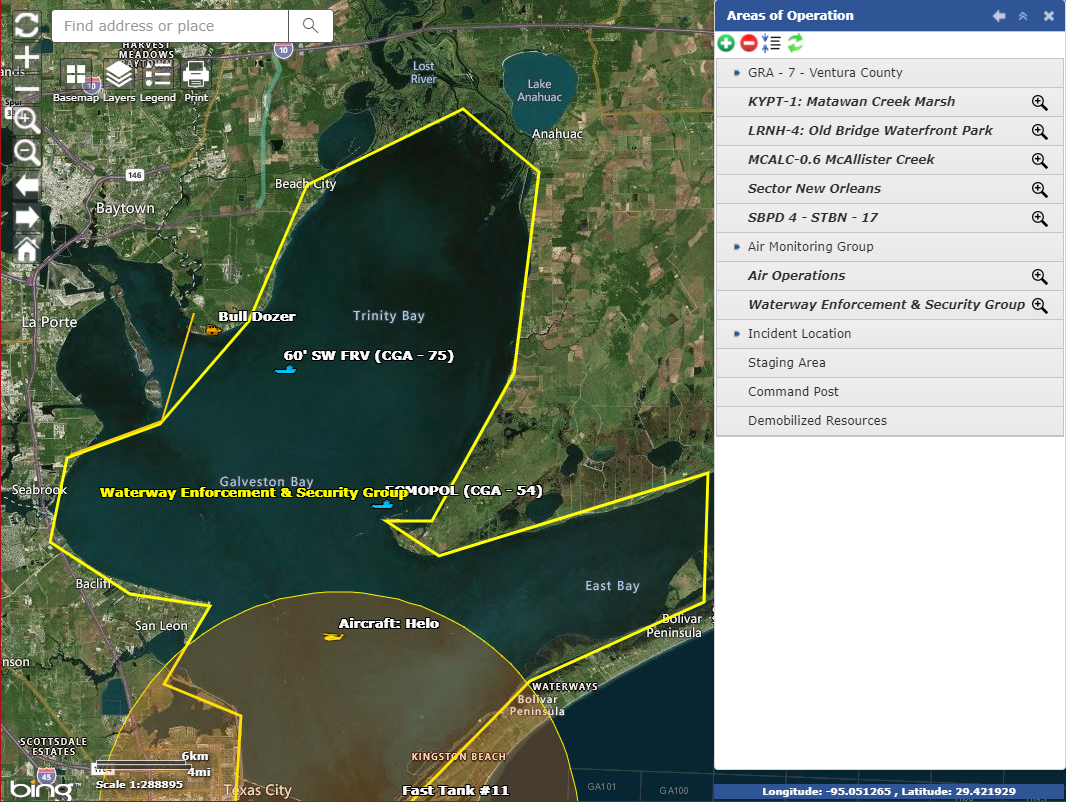
Click on the IAP Tool Menu button  to open the pane on the right.
Next select the Areas of Operation option  to open the list of Areas.
Click on the Area Name to expand the options available for the Area.
Click the Zoom button  to center the map on the selected item.
To add the Area to the map, click the Add Area Location button  . Then click on the map where the Area should be added.
To edit the location, click the Edit Area Location button  then click to assign the new location. Next click the Finish Edit button
  .
.
The Remove Area Location button  is used to remove the location for the Area of Operation from the map.
Areas of Operation that have a work assignment designated will be displayed with bold text. To view the assignment, click the Show work assignment link  .
.
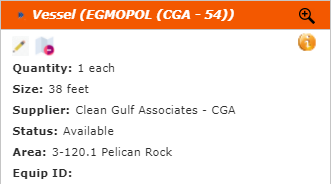
Resources assigned to the incident can be assigned and displayed on the map to provide a visual representation of response activities.
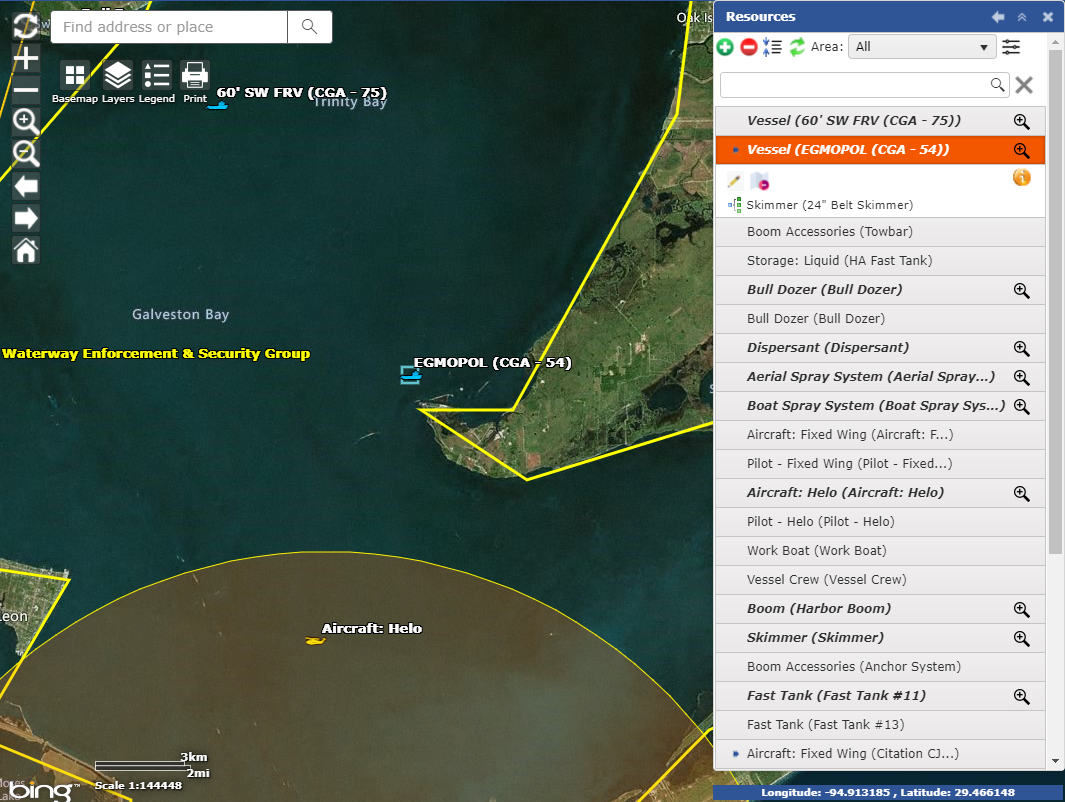
Click on the IAP Tool Menu button  to open the pane on the right.
Next select the Resources option  to open the list of Incident Resources.
Click on the Resource Name to expand the options available for the Resources.
NOTE: Resources that have a location designated will be displayed with bold text. Resources that have grouped children resources are designated with a arrow  . Click the parent resource to expand it and view all associated child resources.
Click the Zoom button  to center the map on the selected item.
To add the Resource to the map, click the Add Resource Location button  . Then click on the map where the Resource should be added.
To edit the location, click the Edit Area Location button  then click to assign the new location. Next click the Finish Edit button
  .
.
The Remove Area Location button  is used to remove the location for the Area of Operation from the map.
Click the Show/Hide Details button  to display a basic summary of resources attributes.
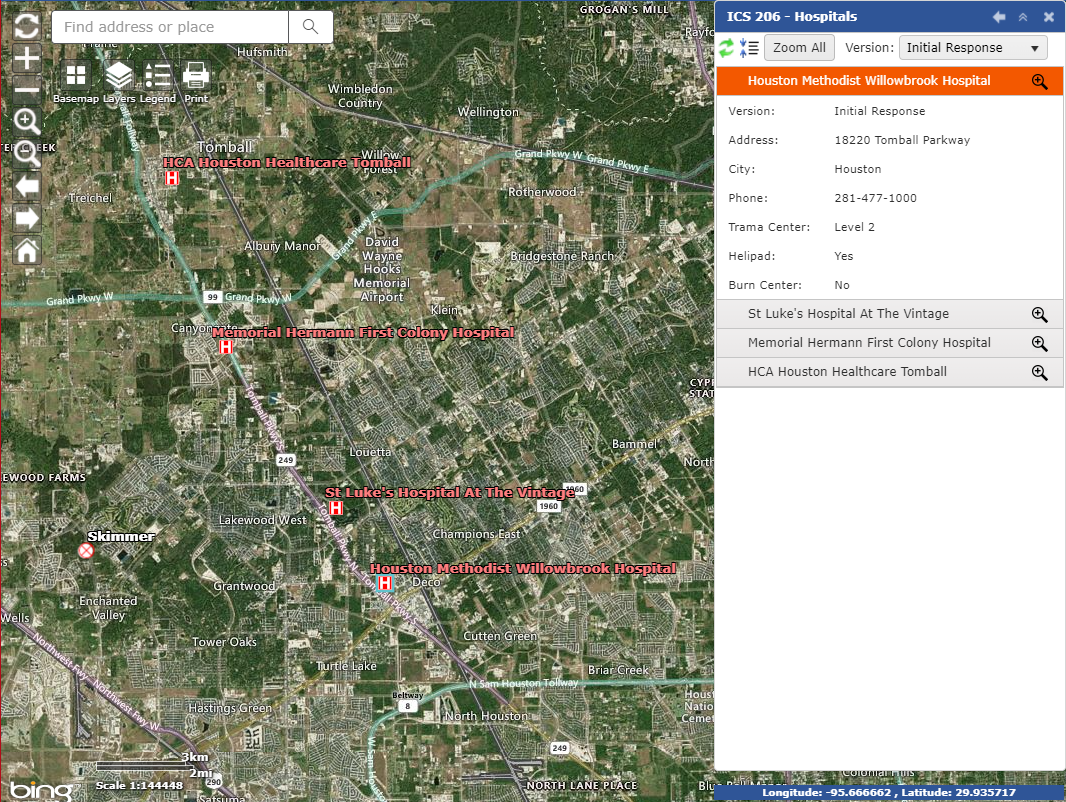
The ICS 206 – Medical form lists Hospitals that have been identified in the areas surrounding the response and available for use if necessary. These hospitals can be displayed on the map.
Click on the IAP Tool Menu button  to open the pane on the right.
Next select the ICS 206 - Hospitals option  to open the list of Hospitals listed on a version of the ICS 206 – Medial Plan form.
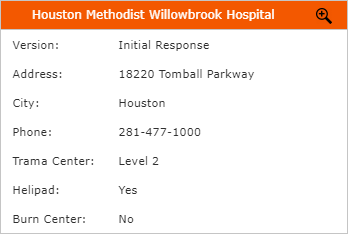
Click on the Hospital Name to display a basic summary of hospital information.
Click the Zoom button  to center the map on the selected item. The Zoom All button
  will change the zoom extent to show all items on the map.
If multiple versions of the ICS 206 – Medical Plan exists, the Version drop-down  can be used to filter the list to show only hospitals from the selected version.
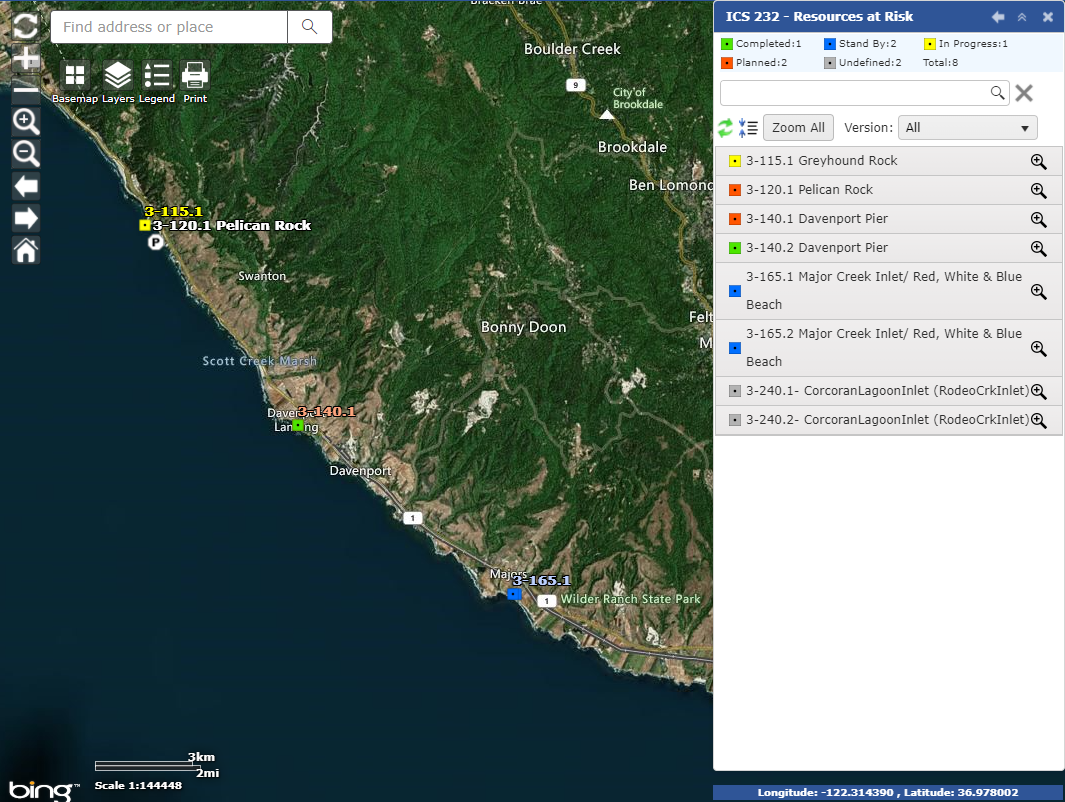
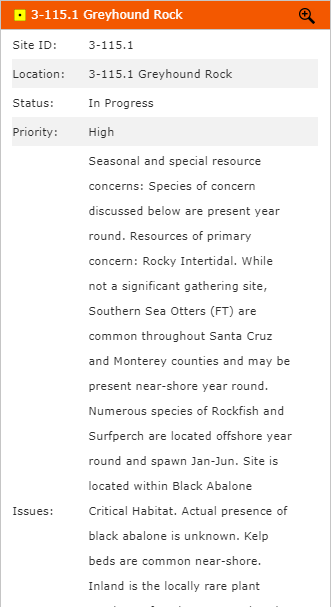
The ICS 232 – Resources at Risk form lists environmental and socioeconomic sites. These sites as well as their protection status can be displayed on the map.
Click on the IAP Tool Menu button  to open the pane on the right.
Next select the ICS 232 – Resources at Risk option  to open the list of identified Resources at Risk sites.
Click on the site Name to display a summary of site information.
Click the Zoom button  to center the map on the selected item. The Zoom All button
  will change the zoom extent to show all items on the map.
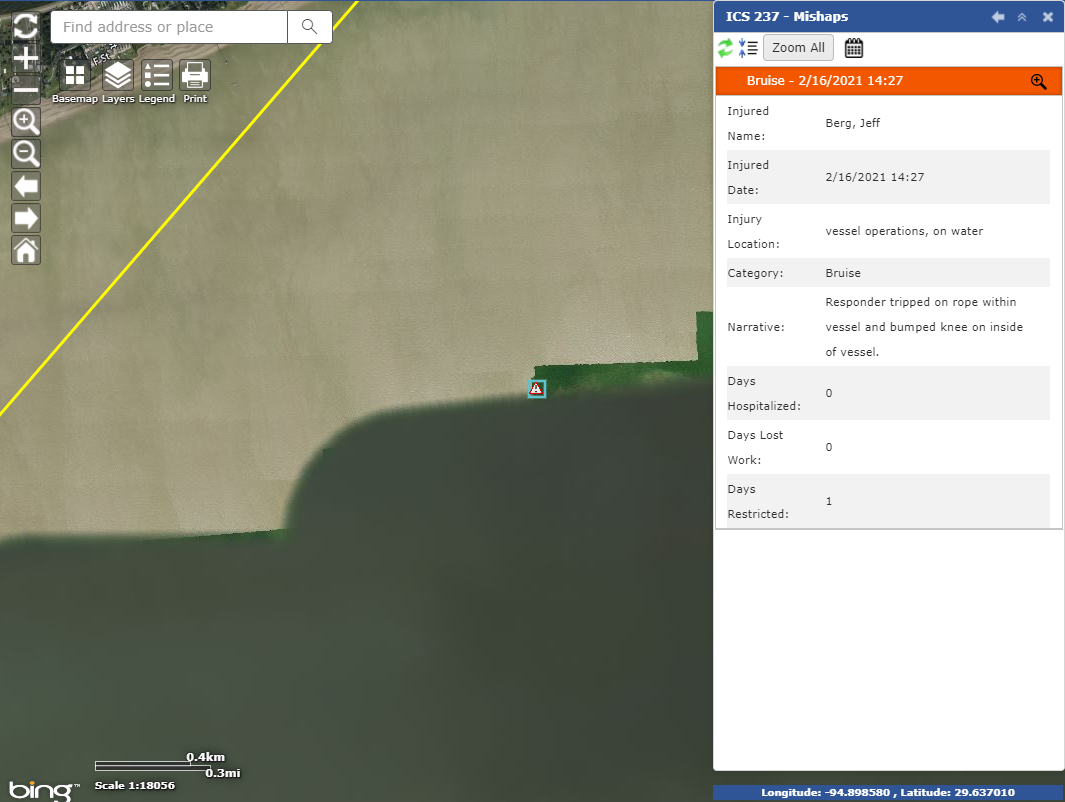
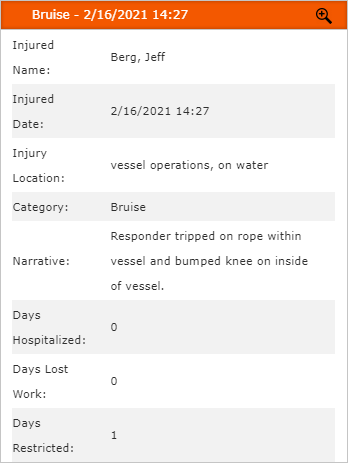
The ICS 237 – Mishaps form documents injuries that occur as part of incident response activities. The locations of any reported mishaps can be shown on the map.
Click on the IAP Tool Menu button  to open the pane on the right.
Next select the ICS 237 – Mishaps option  to open the list of documented mishaps.
Click on an item to display a summary of mishap information.
Click the Zoom button  to center the map on the selected item. The Zoom All button
  will change the zoom extent to show all items on the map.
Use the Filter by Date button  to show mishaps that occurred between the specified date range.
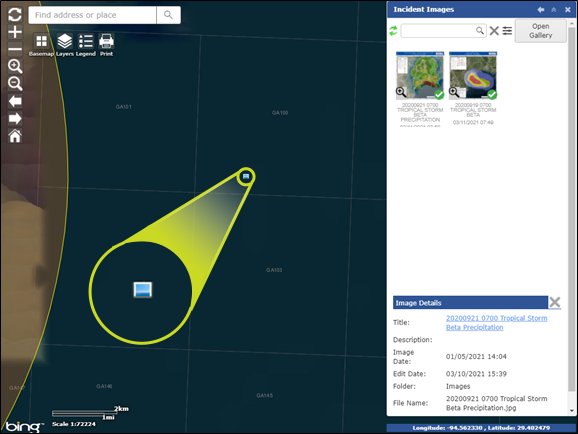
As images are added to the incident they can be assigned to a specific location. Images must be approved for display before being available to be shown on the map.
Click on the IAP Tool Menu button  to open the pane on the right.
Next select the Incident Images option  to open the list of images approved for display.
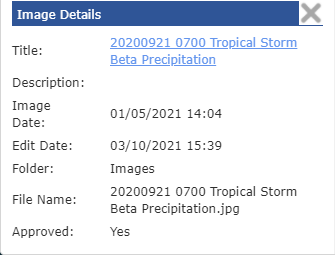
Click on an item to display the Image Details.
 to open the image in a separate window.
 in the bottom left corner of a thumbnail to locate the image
  on the map.
 will open a new window and display the approved images. Users can scroll though all of the images within this window.
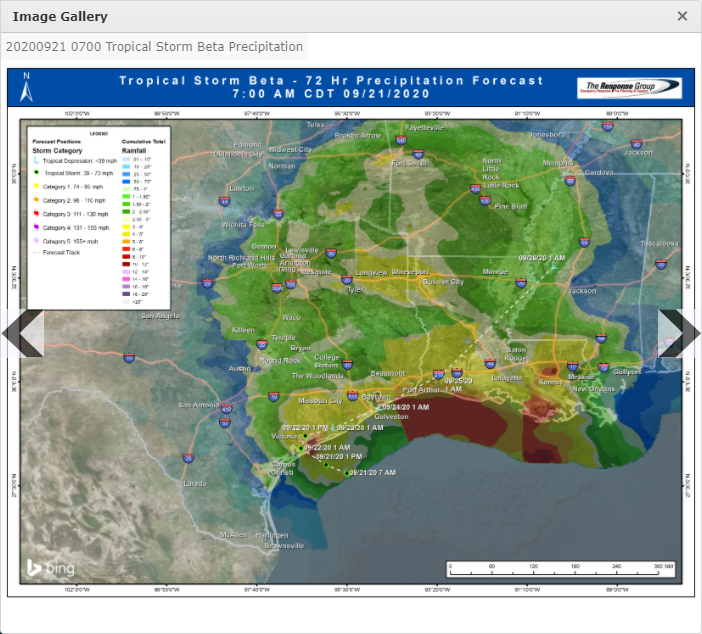
© 2024, TRG The Response Group LLC., All rights are reserved.
No part of this web site, and the information which it contains, may be reproduced, stored in a retrieval system or transmitted in any form or by any means, electronic, mechanical, photocopying, recording or otherwise, without prior written permission of TRG.